Memberhip Statistics - August 2024
Number of members: 5615#
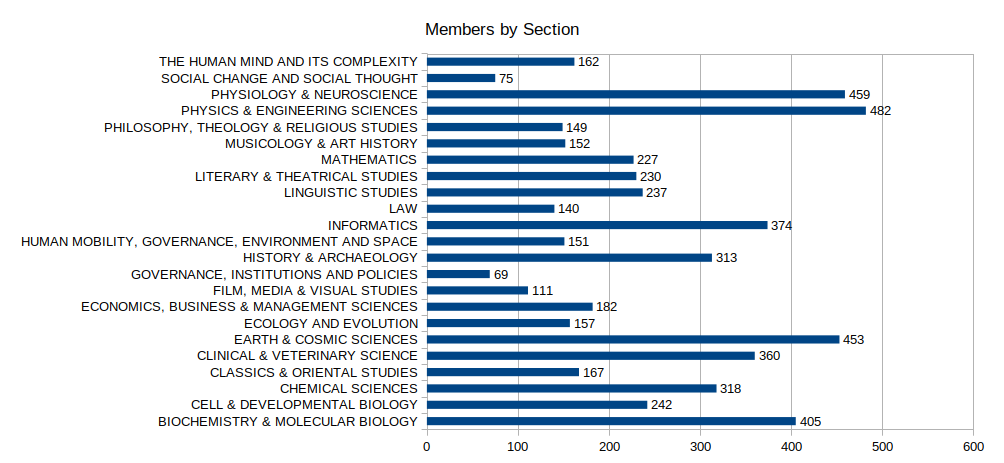
Members by Section#
| Section | Members | Female | Female (Percent) |
|---|---|---|---|
| BIOCHEMISTRY & MOLECULAR BIOLOGY | 405 | 85 | 21,0 % |
| CELL & DEVELOPMENTAL BIOLOGY | 242 | 48 | 19,8 % |
| CHEMICAL SCIENCES | 318 | 53 | 16,7 % |
| CLASSICS & ORIENTAL STUDIES | 167 | 45 | 26,9 % |
| CLINICAL & VETERINARY SCIENCE | 360 | 55 | 15,2 % |
| EARTH & COSMIC SCIENCES | 453 | 55 | 12,1 % |
| ECOLOGY AND EVOLUTION | 157 | 24 | 15,3 % |
| ECONOMICS, BUSINESS & MANAGEMENT SCIENCES | 182 | 31 | 17,0 % |
| FILM, MEDIA & VISUAL STUDIES | 111 | 54 | 48,6 % |
| GOVERNANCE, INSTITUTIONS AND POLICIES | 69 | 24 | 34,8 % |
| HISTORY & ARCHAEOLOGY | 313 | 68 | 21,7 % |
| HUMAN MOBILITY, GOVERNANCE, ENVIRONMENT AND SPACE | 151 | 29 | 19,2 % |
| INFORMATICS | 374 | 32 | 8,6 % |
| LAW | 140 | 37 | 26,4 % |
| LINGUISTIC STUDIES | 237 | 91 | 38,4 % |
| LITERARY & THEATRICAL STUDIES | 230 | 80 | 34,8 % |
| MATHEMATICS | 227 | 28 | 12,3 % |
| MUSICOLOGY & ART HISTORY | 152 | 38 | 25,0 % |
| PHILOSOPHY, THEOLOGY & RELIGIOUS STUDIES | 149 | 42 | 28,2 % |
| PHYSICS & ENGINEERING SCIENCES | 482 | 42 | 8,7 % |
| PHYSIOLOGY & NEUROSCIENCE | 459 | 75 | 16,3 % |
| SOCIAL CHANGE AND SOCIAL THOUGHT | 75 | 21 | 28,0 % |
| THE HUMAN MIND AND ITS COMPLEXITY | 162 | 48 | 29,6 % |
| Sum | 5615 | 1105 | 19,7 % |
Click to enlarge.

AE members by sections in Class A1. Click to enlarge.

AE members by sections in Class A2. Click to enlarge.

AE members by sections in Class B. Click to enlarge.

AE members by sections in Class C. Click to enlarge.
Members by class#

| Class | Members | Female | Female (Percent) |
|---|---|---|---|
| A1 - Humanities | 1359 | 418 | 30,8 % |
| A2 - Social and Related Sciences | 779 | 190 | 24,4 % |
| B - Exact Sciences | 1854 | 210 | 11,3 % |
| C - Life Sciences | 1623 | 287 | 17,7 % |
| Sum | 5615 | 1105 | 19,7 % |
Members by age#

| Age | Number |
|---|---|
| <= 40 | 18 |
| 41-45 | 67 |
| 46-50 | 237 |
| 51-55 | 454 |
| 56-60 | 742 |
| 61-65 | 909 |
| 66-70 | 900 |
| 71-75 | 743 |
| 76-80 | 659 |
| 81-85 | 471 |
| 86-90 | 300 |
| 91+ | 115 |
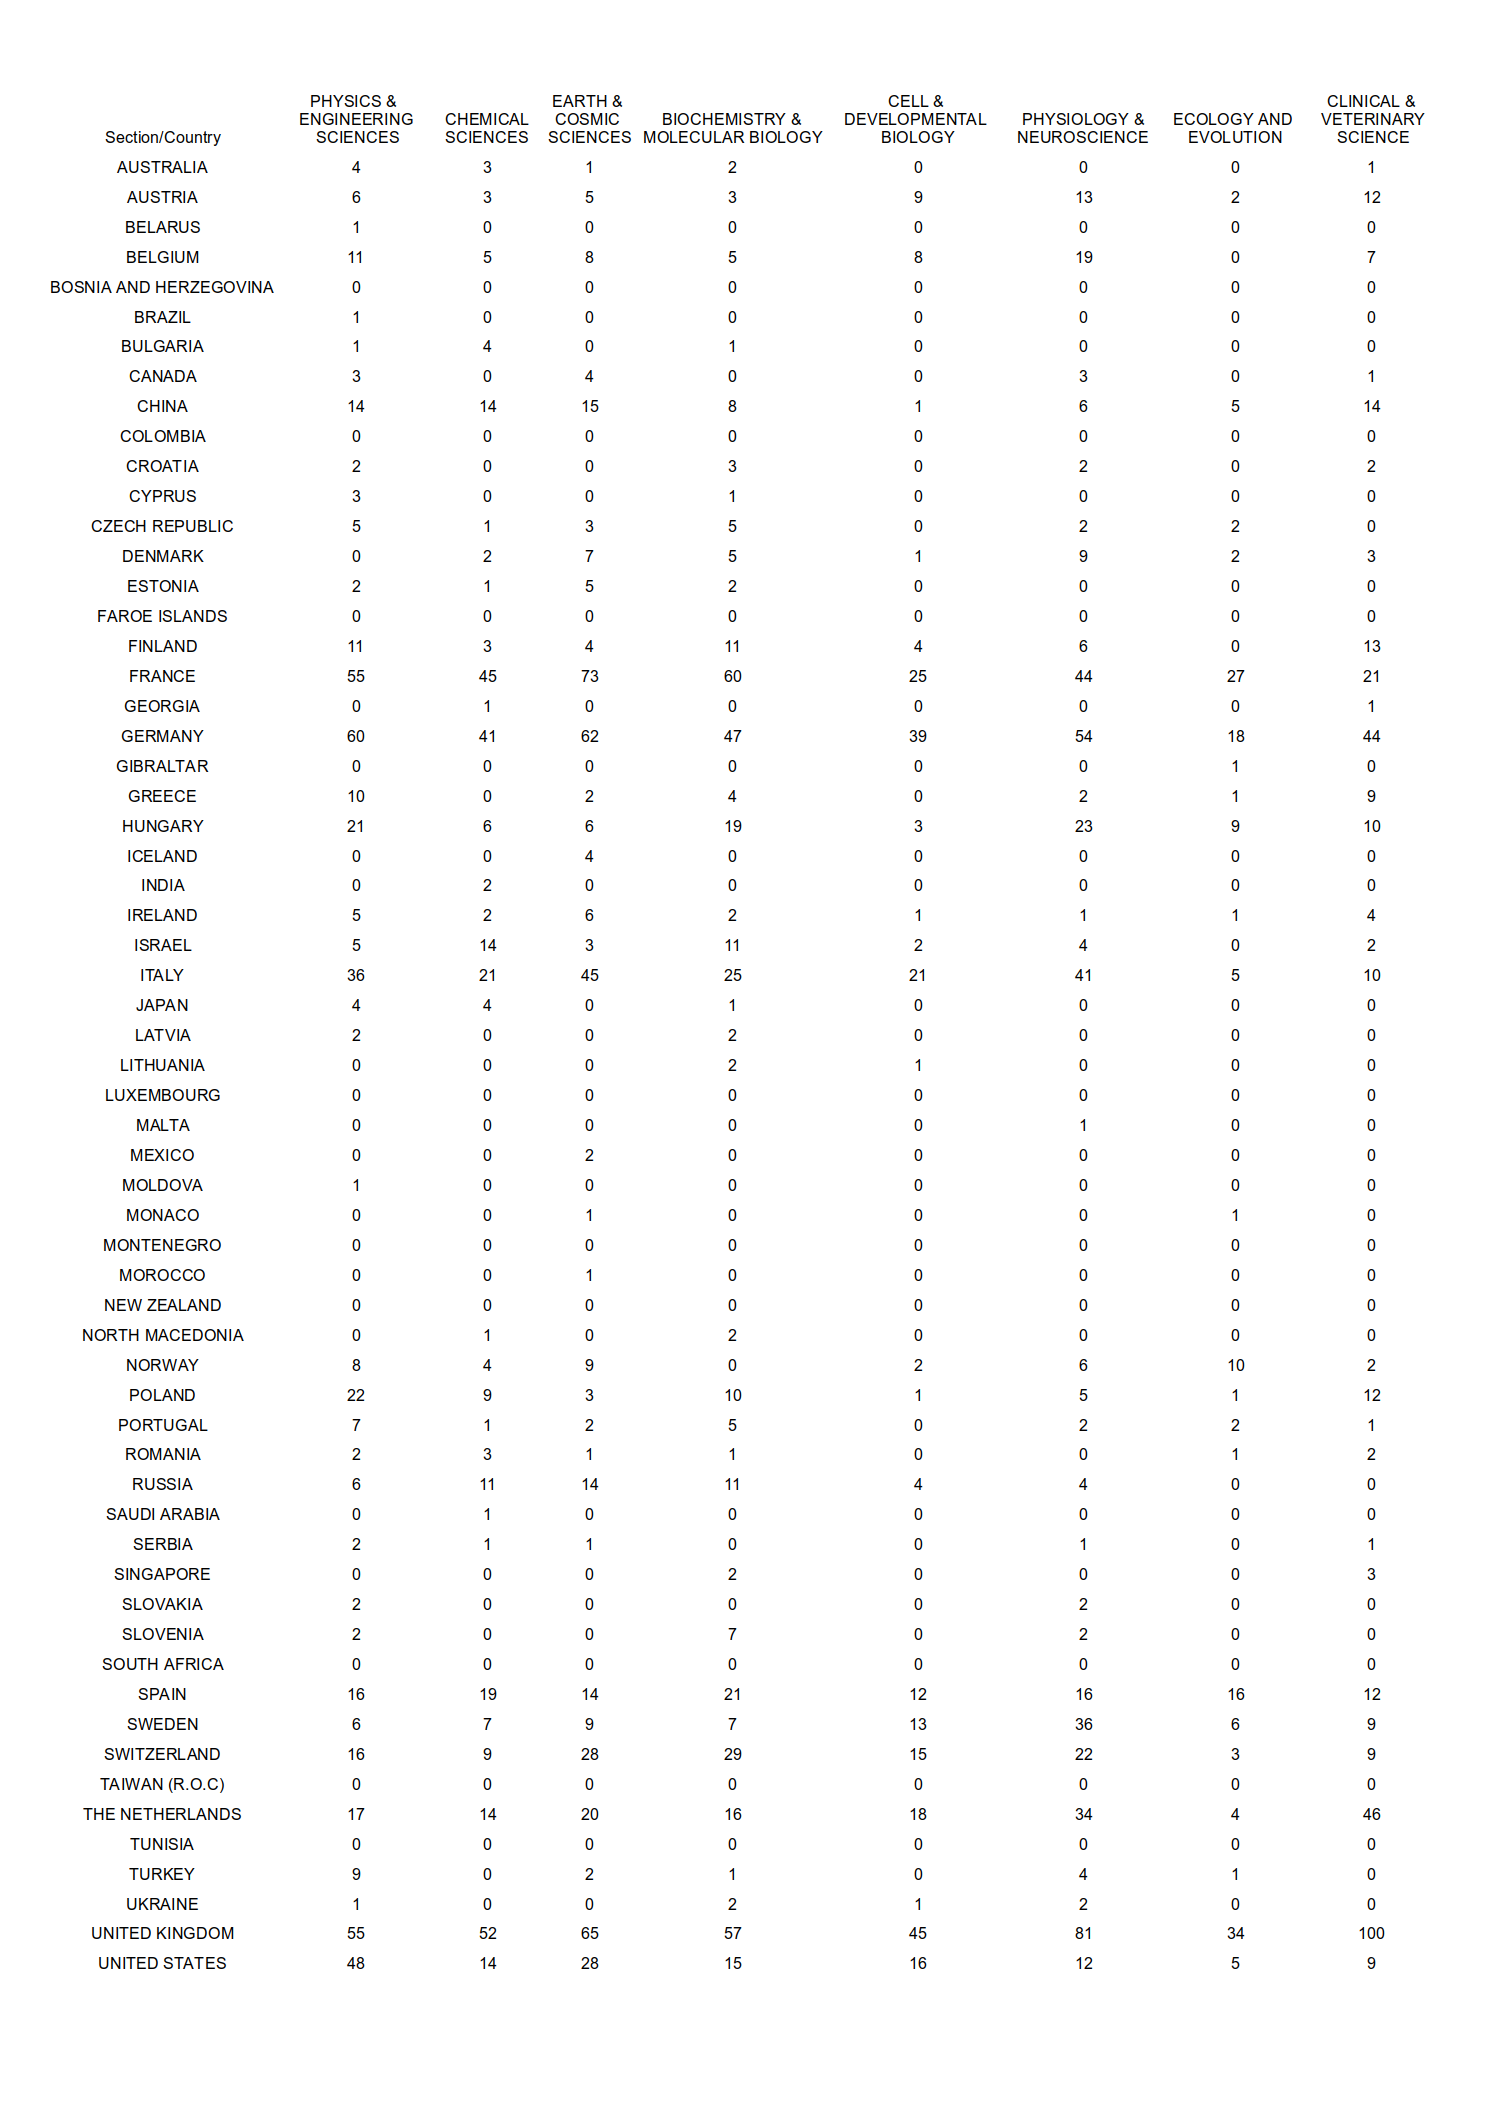
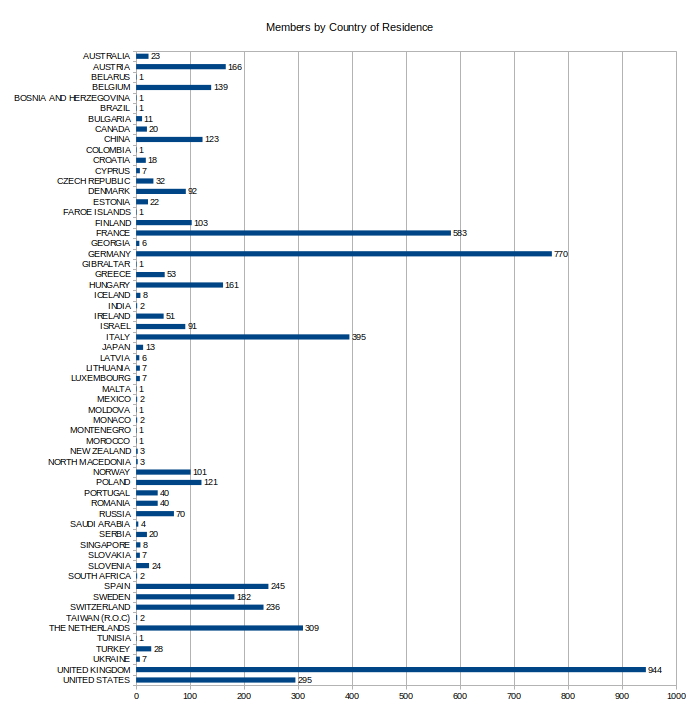
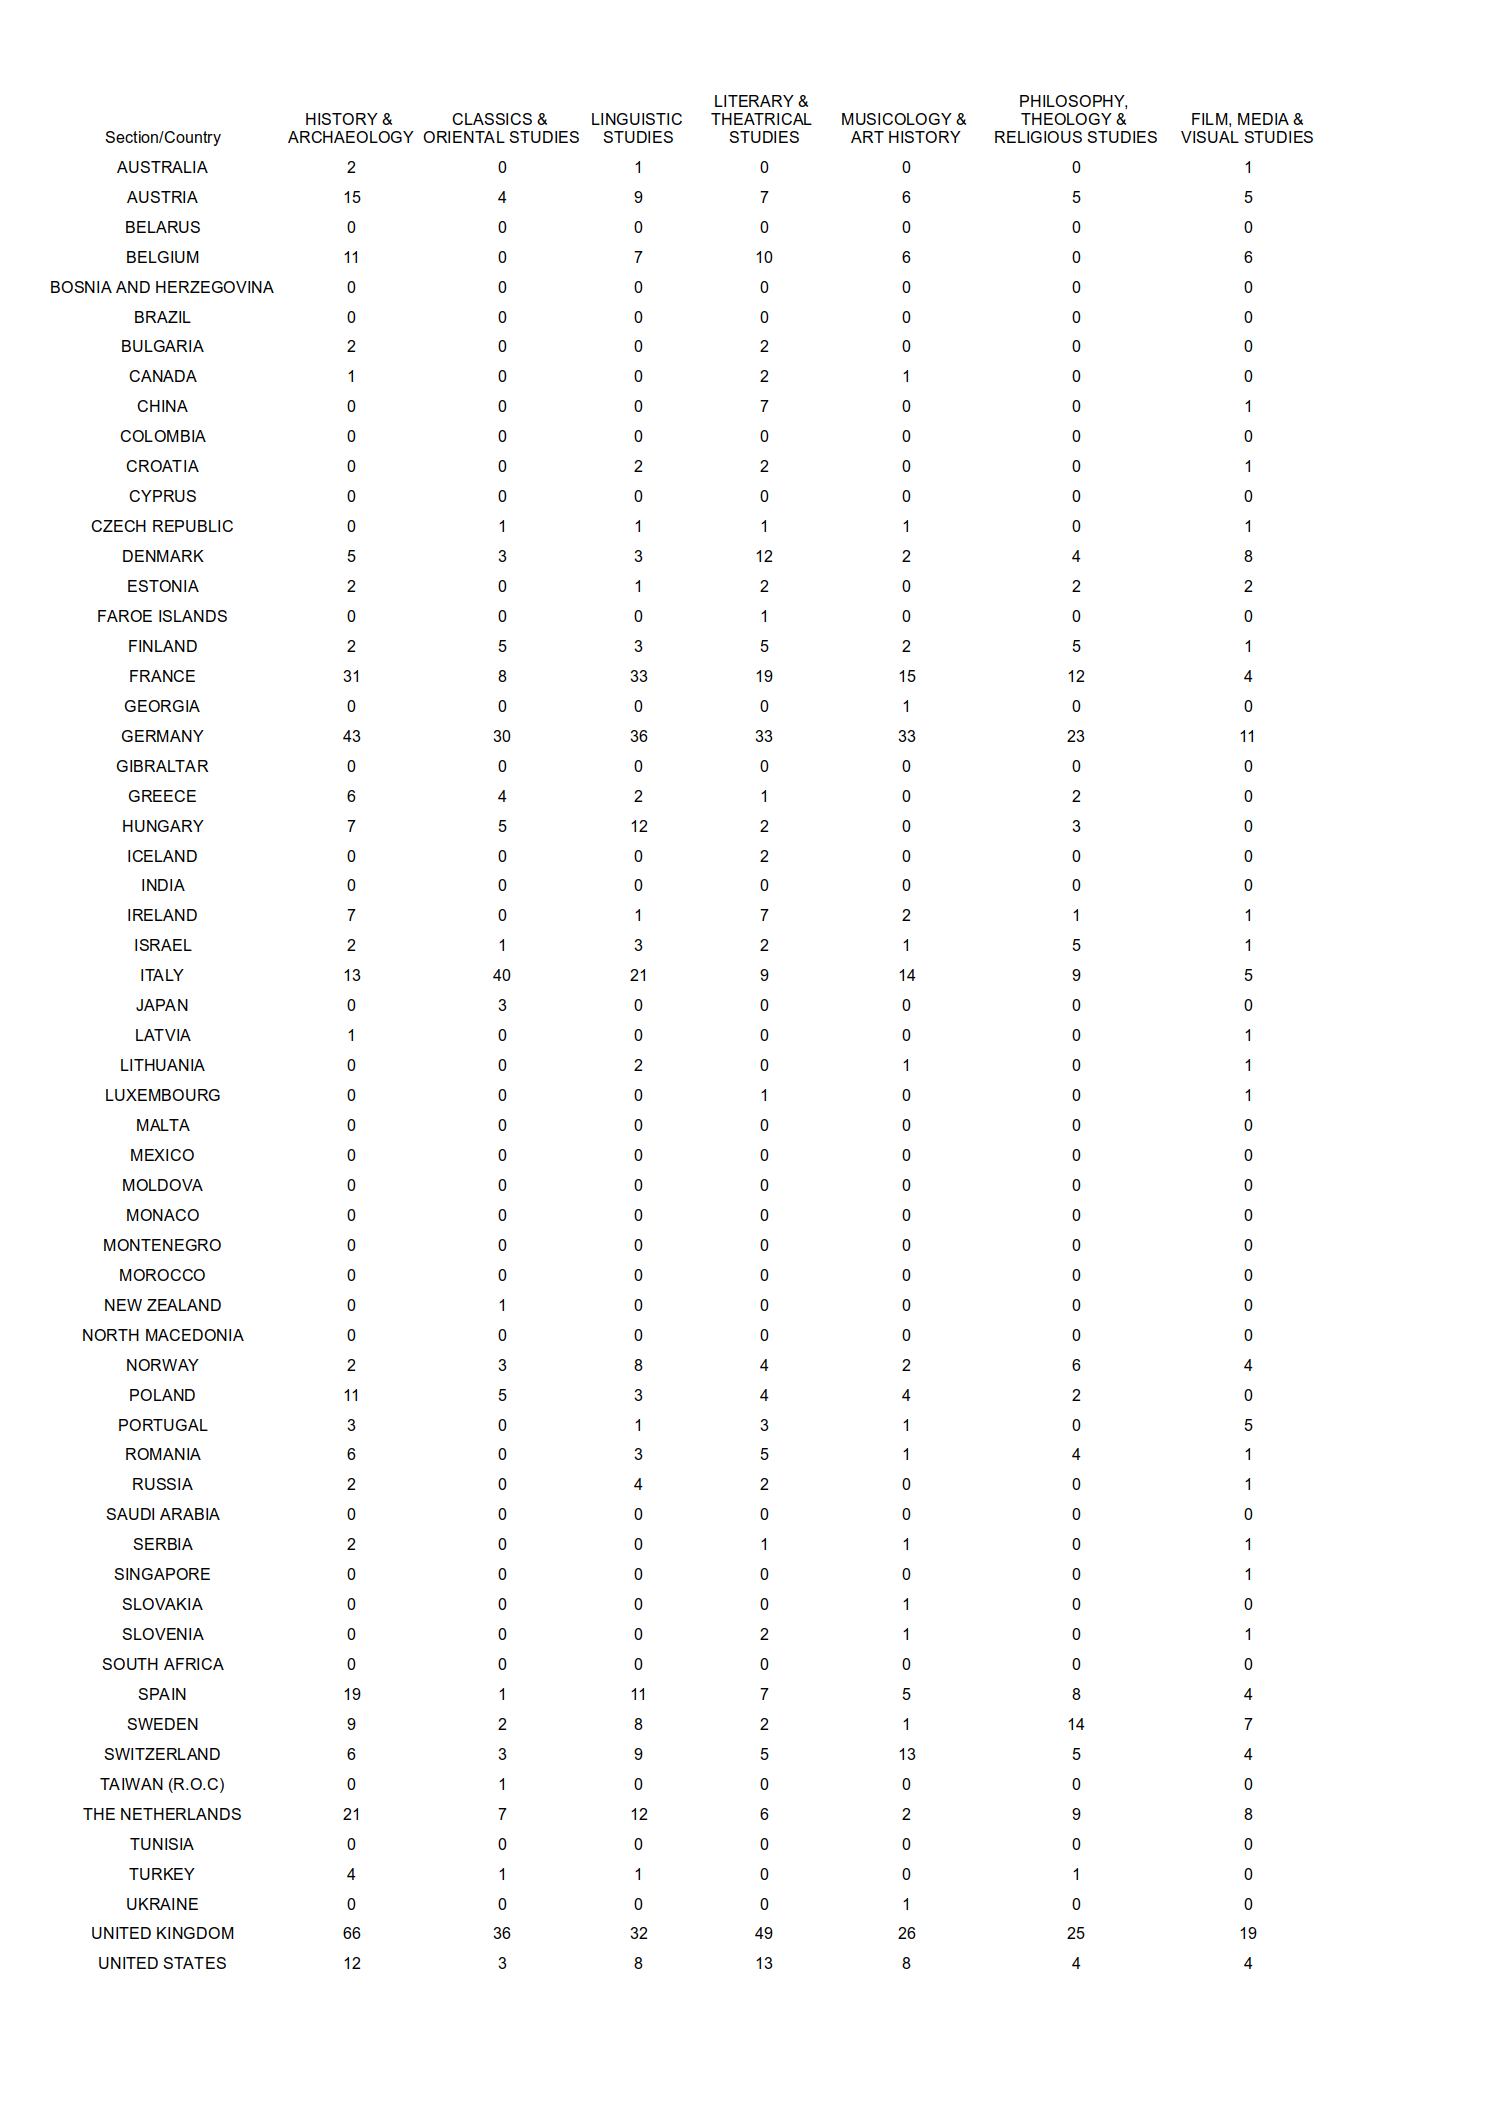
Members by Section and Country of Residence#
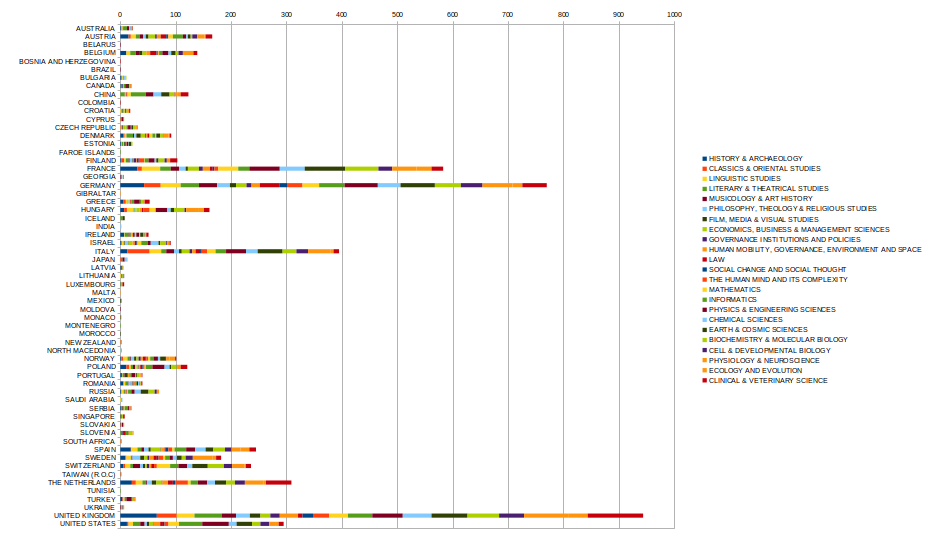
Members by country and section (I.)#
Members by country and section (II.)#
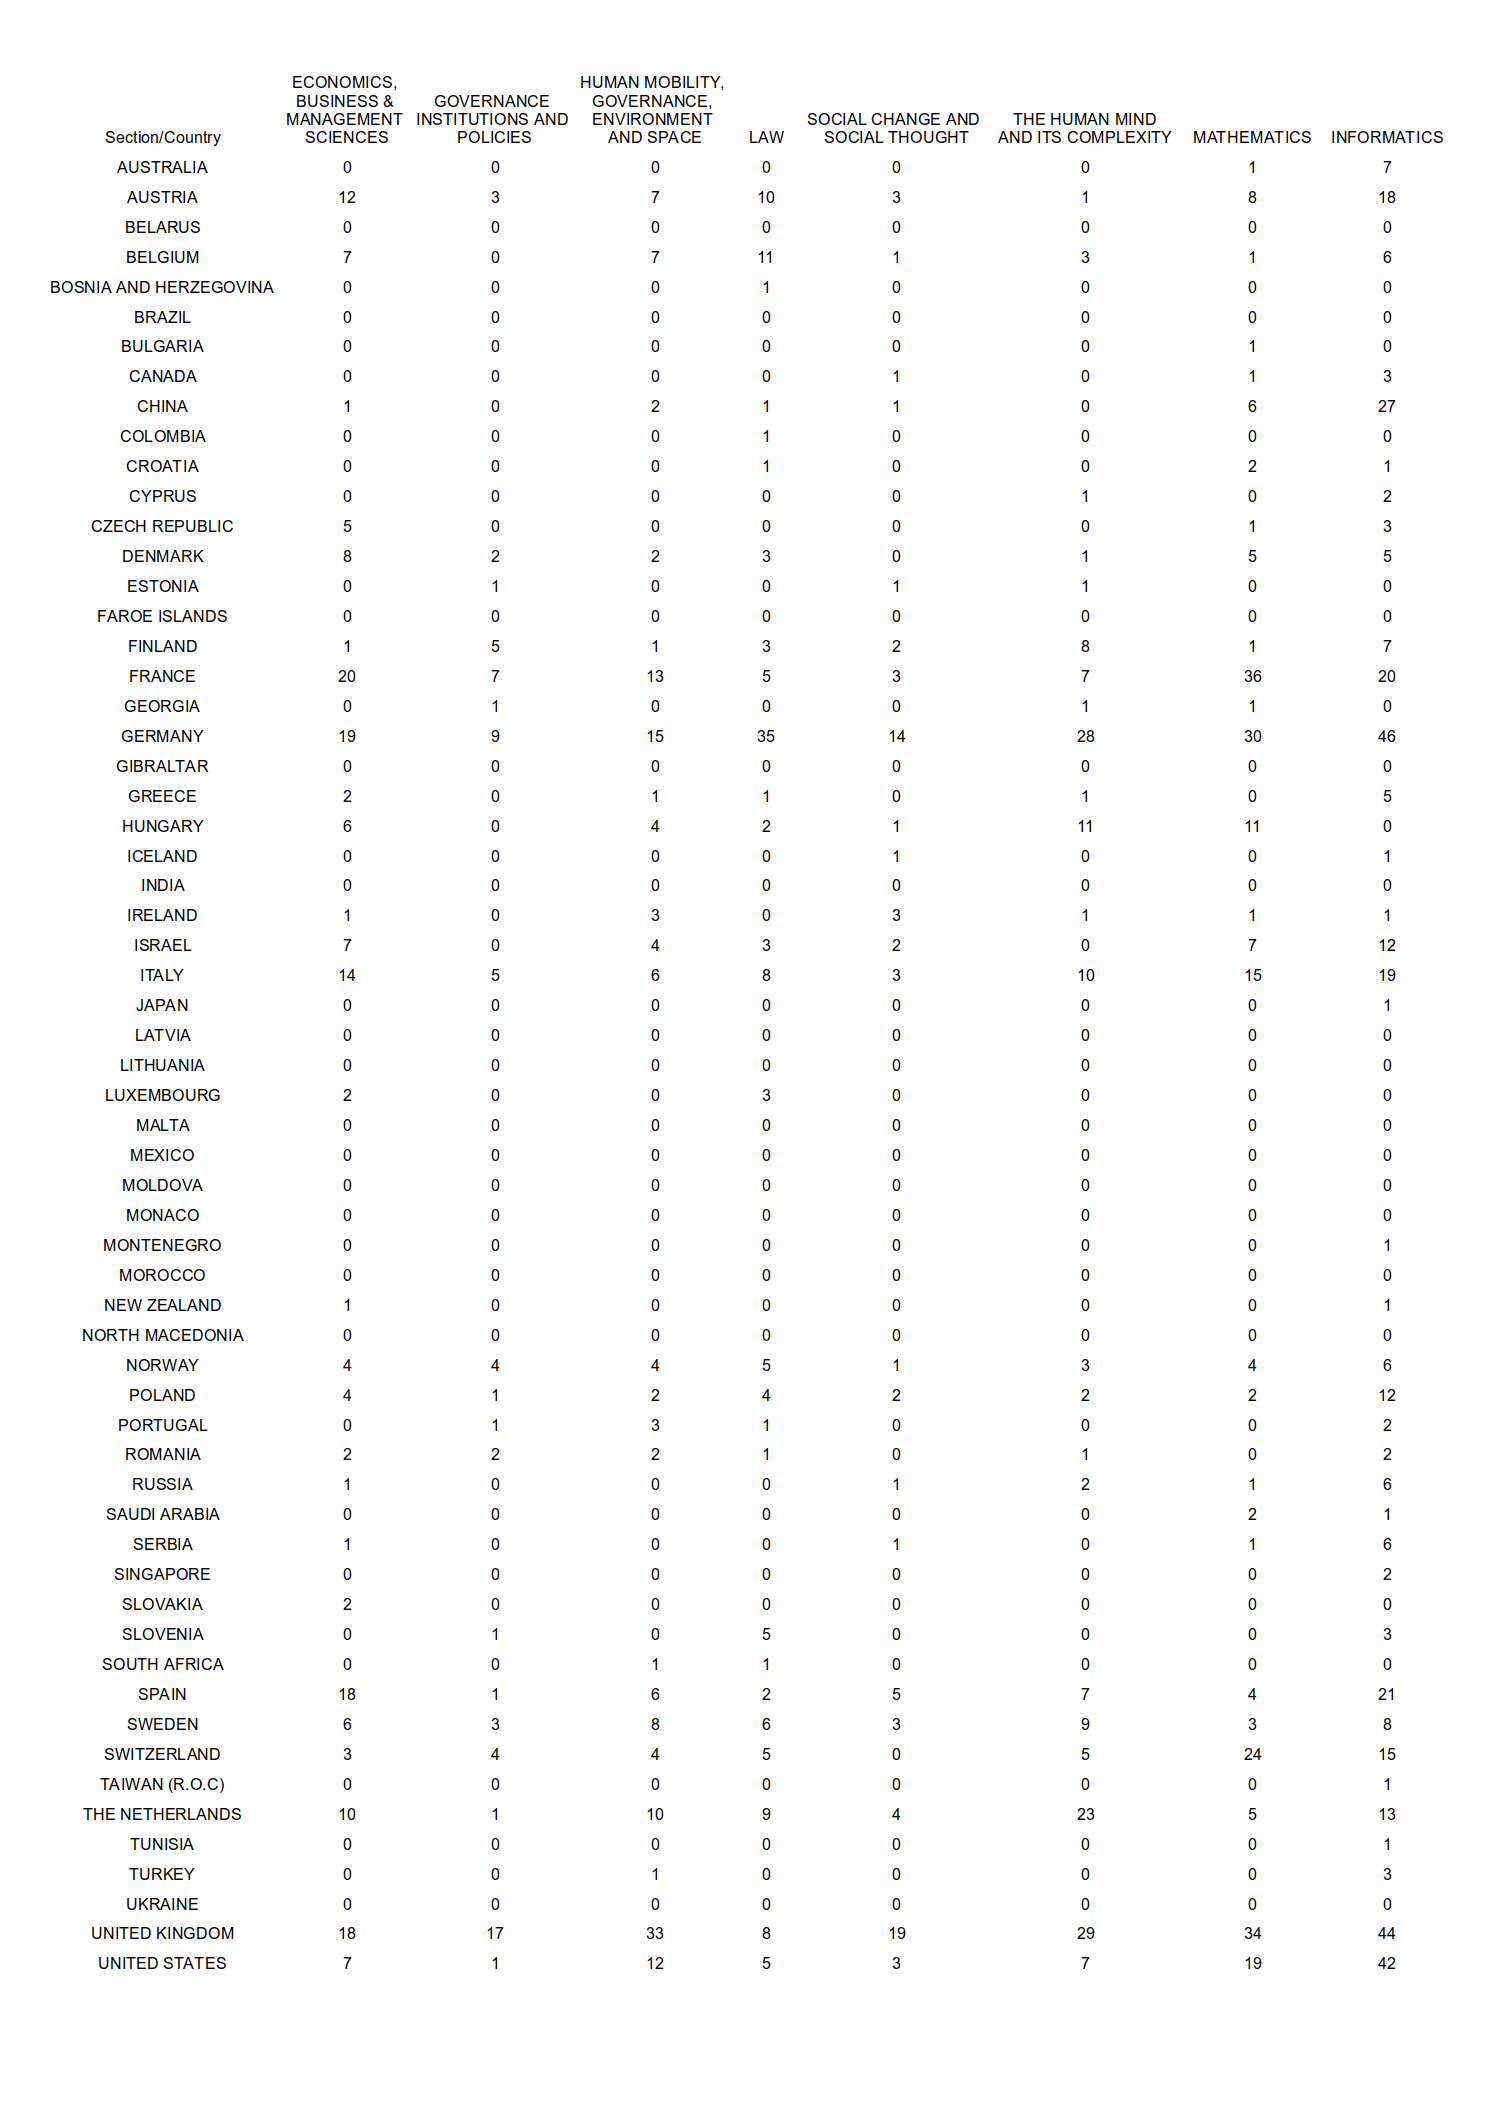
Members by country and section (III.)#